All B-Agent apps Home
Case study · B-Agent

B-Agent Atlas

See your Microsoft 365 security, users and licences at a glance.

Rebuilt a colleague's PowerShell reporting script as a React app, end to end: the Graph data layer, the risk rules, the dashboards and the AI assistant.

15delegated Graph permissions
20requests per Graph batch
4risk levels, Low to Critical
7report views
The problem

IT admins answer security and licence questions about Microsoft 365 by running PowerShell scripts and stitching exports together. The built-in usage reports often hide user names, so even the exports can't say who a row belongs to.

The approach

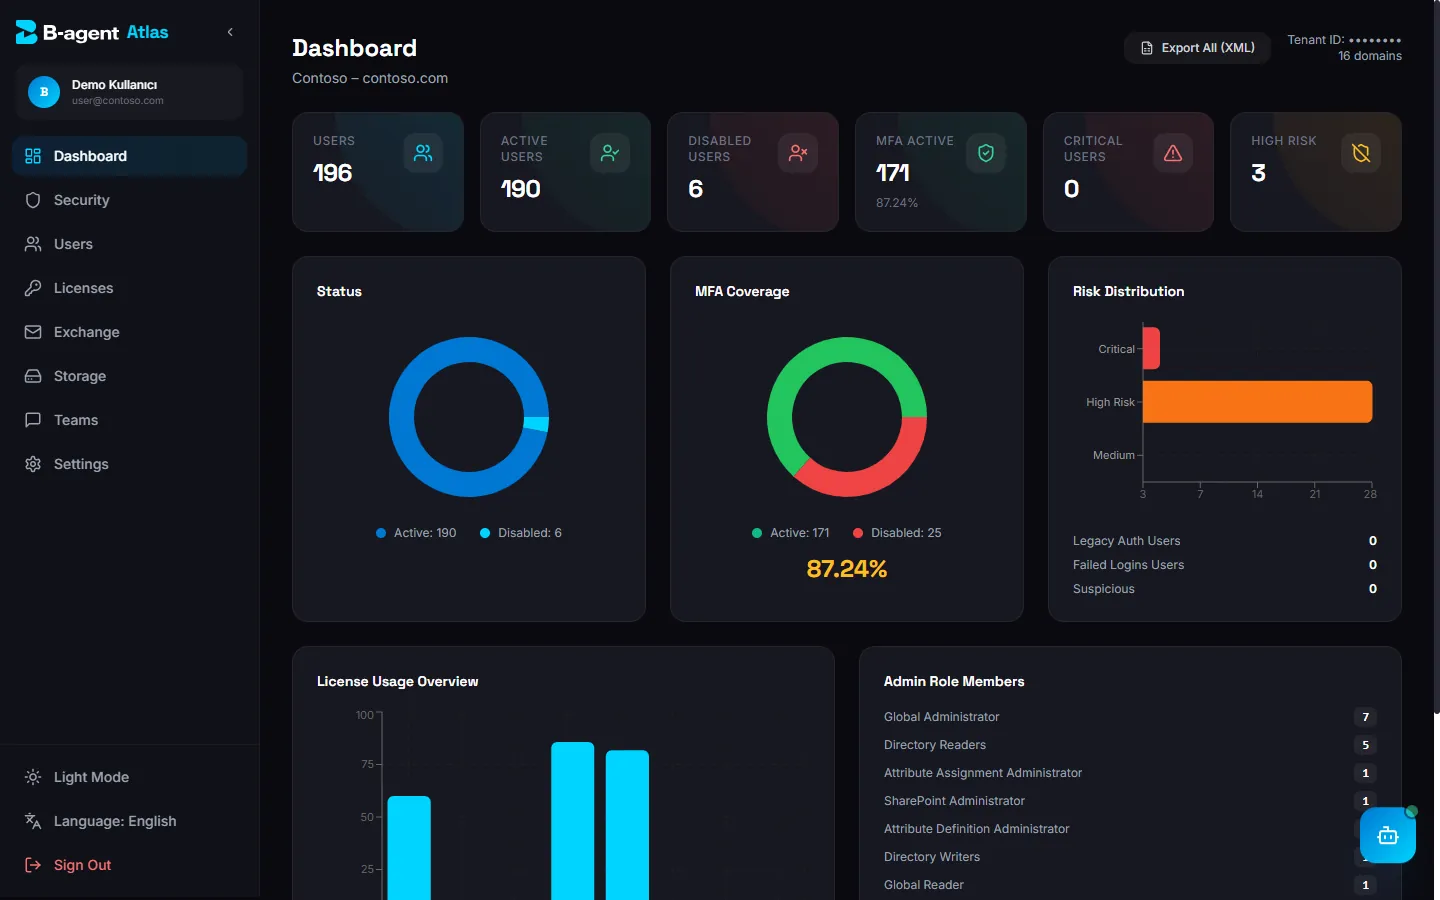
A browser app that signs the admin in and reads Microsoft Graph with their own delegated token, then turns users, sign-ins, licences, mailboxes, storage and Teams into one dashboard. A per-user risk level comes from plain rules an admin can read, and an AI assistant answers questions over the same data.

How it works

From request to answer, step by step.

  1. 01Admin signs inMSAL, a multi-tenant Entra app with delegated Graph permissions
  2. 02Graph readsPaged queries and batches of 20 requests
  3. 03Usage reportsMailbox, OneDrive and SharePoint reports, privacy setting checked
  4. 04Re-identify rowsHidden names resolved by id lookups and size fingerprints
  5. 05Risk scoringMFA, admin roles, legacy auth, failed and foreign sign-ins
  6. 06Dashboards and AIViews with CSV export, chat assistant, emailed Excel reports

What it does

  • A tenant health dashboard: MFA coverage, risk, licence use, admin roles and storage.
  • A security report per user: risk level, MFA, failed sign-ins, legacy auth, sign-ins from several countries.
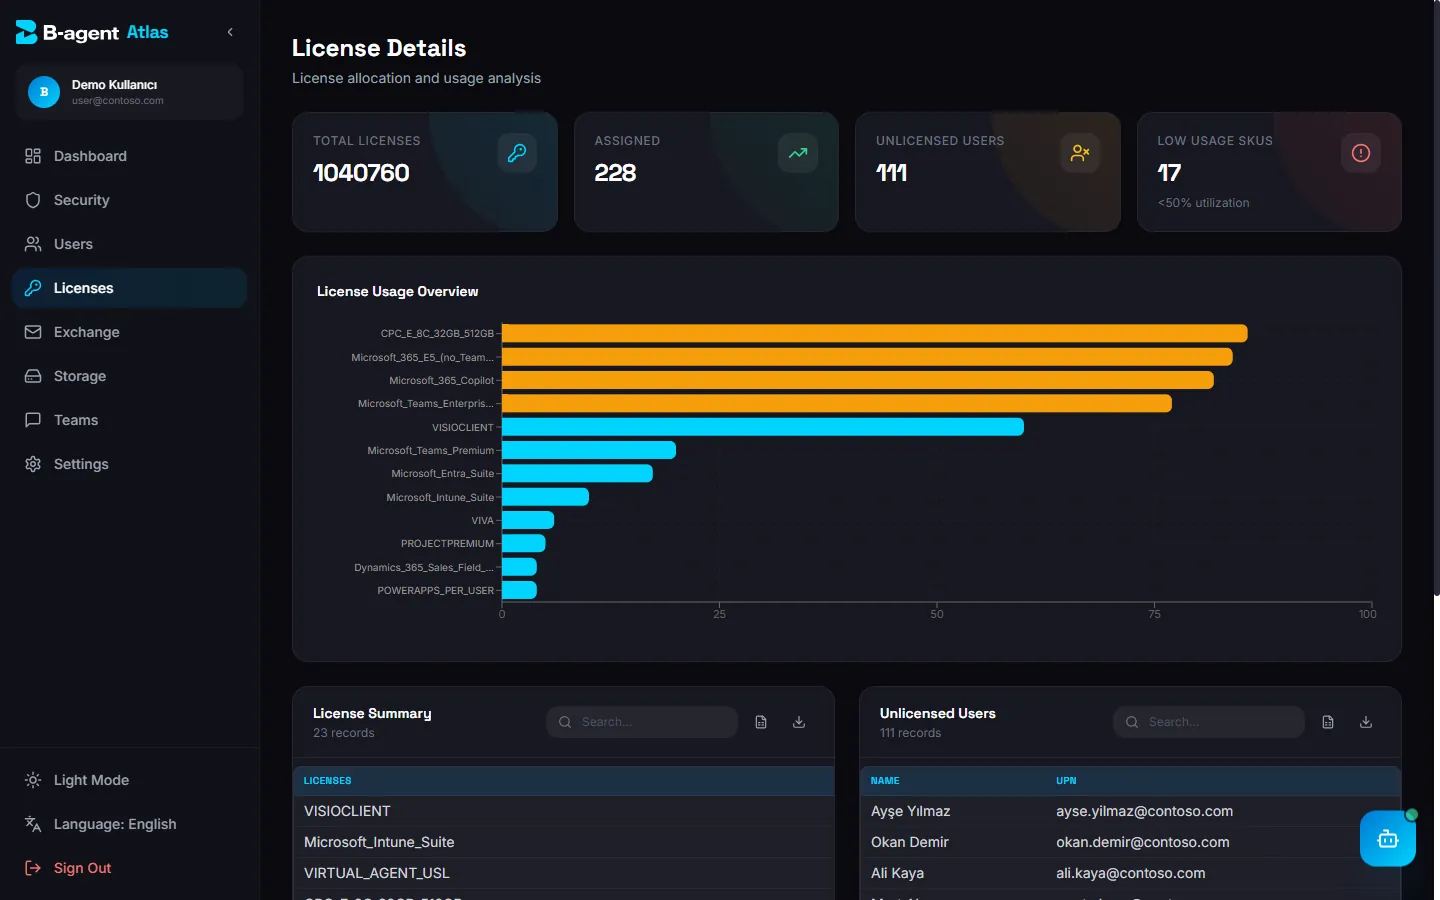
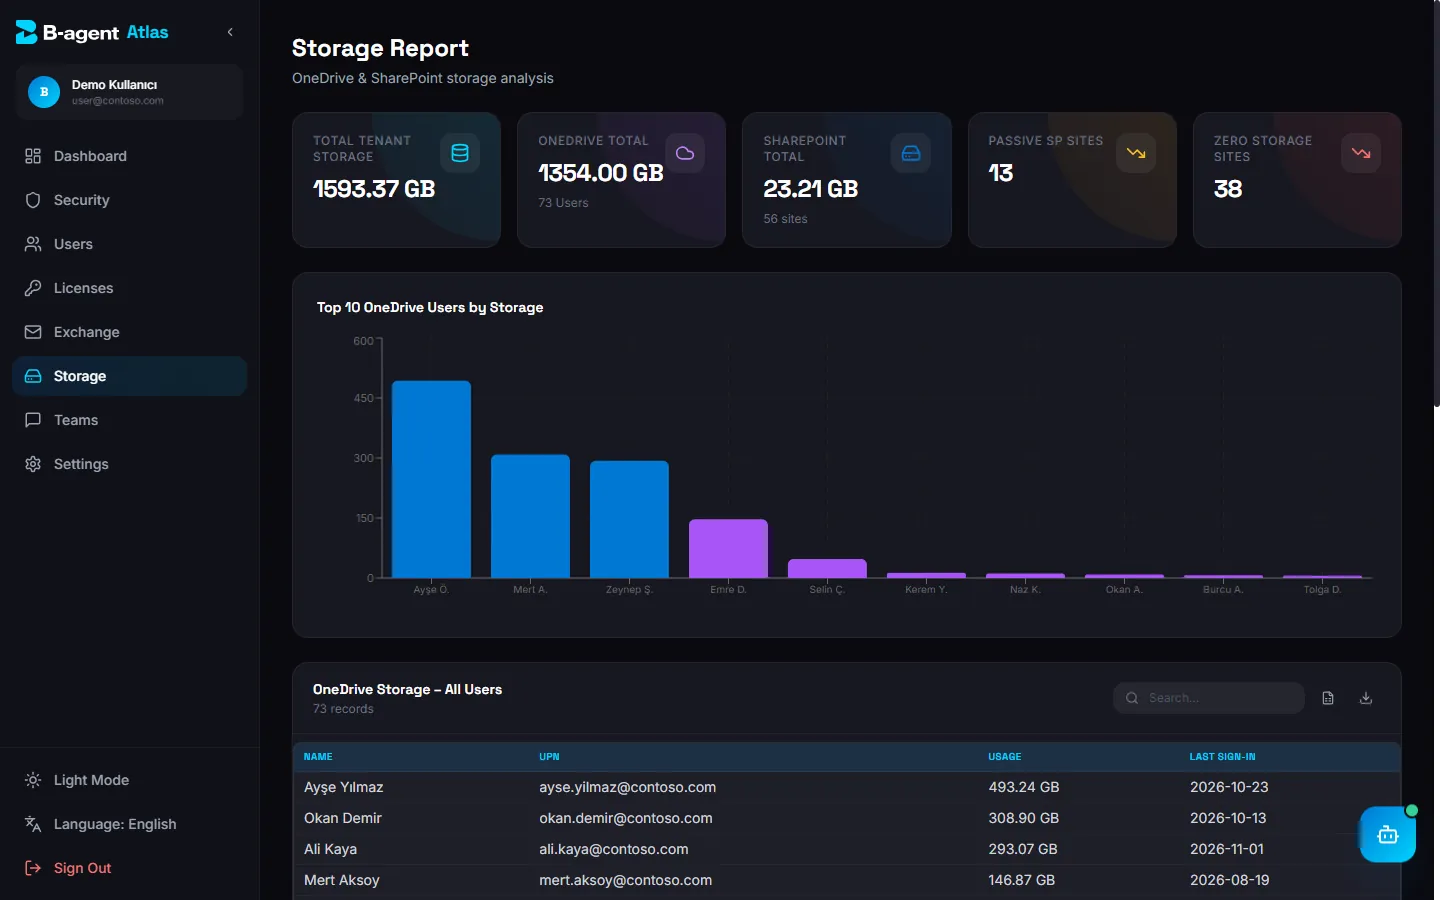
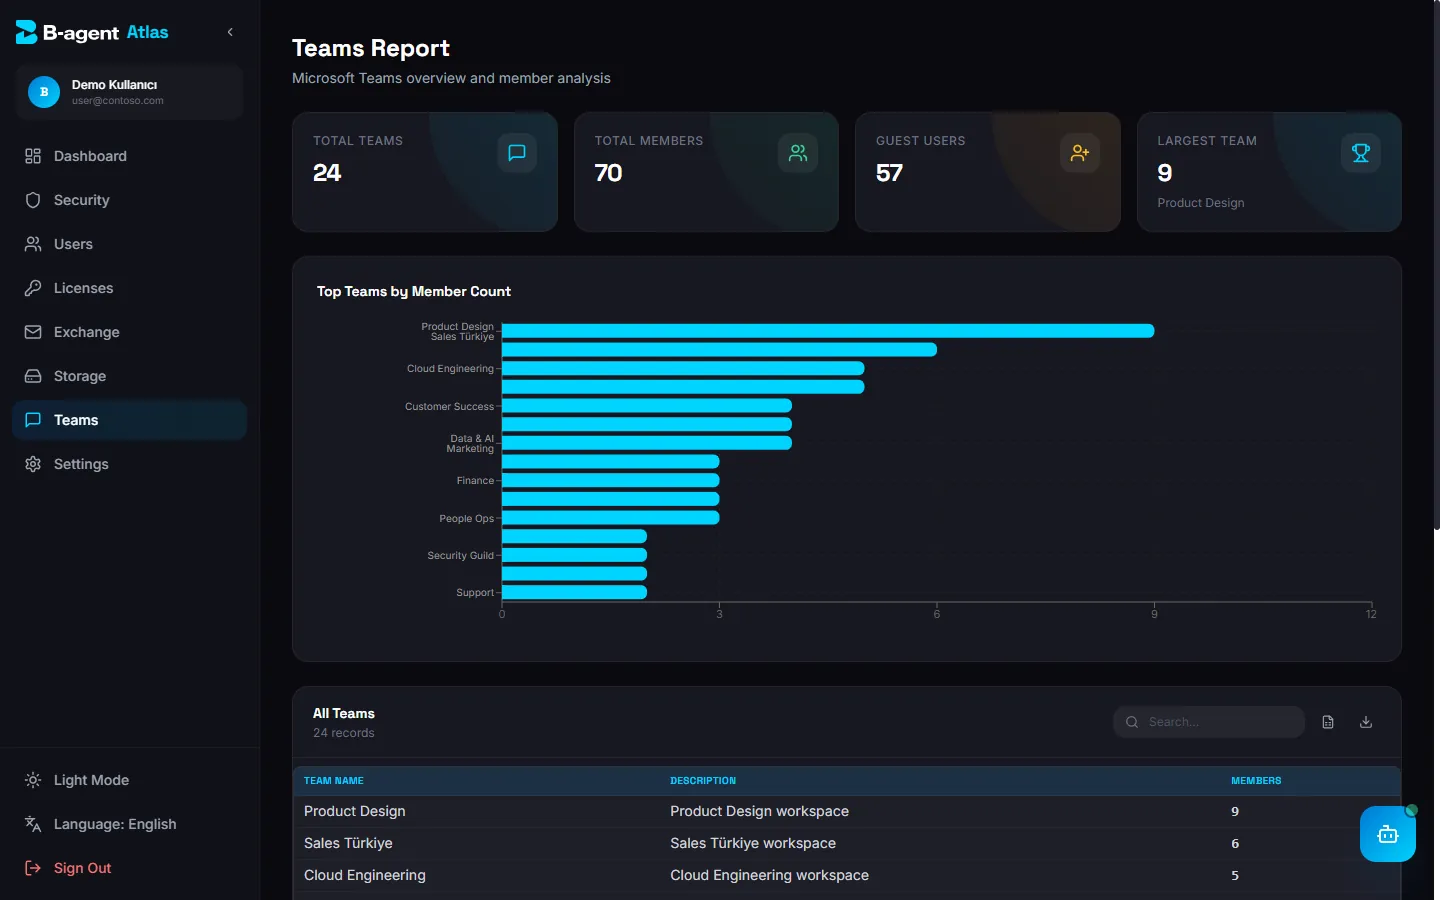
  • Licence, mailbox, OneDrive and SharePoint storage and Teams views, with search and CSV export.
  • Ask the built-in AI assistant about your tenant, or email a report with an Excel attachment.

Under the hood

  • Runs in the browser and reads Microsoft Graph with the signed-in admin's own token.
  • Spots when Microsoft 365 usage reports are anonymised and can switch that setting through the Graph admin API.
  • Started life as a PowerShell reporting script; I rebuilt it as a React app.
Hard problems

What took real engineering.

Problem 1

Reports that hide who is who

Microsoft 365 usage reports can conceal user names, which makes per-user storage figures useless. Atlas checks the tenant's report setting and can switch concealment off through the Graph admin API, a change that takes hours to apply. Meanwhile it resolves hidden rows itself: ids are looked up in batches, and mailbox rows are matched to users by item count and size within a tolerance, never giving one user two rows.

Problem 2

A tenant scan in batches

A full scan means thousands of Graph calls: every user, their MFA methods, roles, mailboxes and drives. Atlas follows paging links and packs lookups into Graph batches of 20 requests instead of one call each. A failed batch is logged and skipped, so one bad chunk never blanks a page.

Problem 3

Risk rules an admin can read

A black-box risk score is hard to act on, so the rules are explicit and ordered. An admin without MFA is Critical; legacy sign-ins without MFA, 60 or more days inactive without MFA, or sign-ins from more than one country is High; more than five failed sign-ins is Medium. Every level traces to a fact on the same row, so an admin can see why a user was flagged.

Built with
ReactViteTailwindMSALMicrosoft GraphAzure OpenAIRecharts